Northwind Atlas
An interactive atlas that makes a national power grid legible to the people who pay for it.
Product and Software
- Client
- Northwind Foundation
- Year
- 2025
- Role
- Product design, data visualisation, front-end
- Time
- 20 weeks
- Crew
- 6 people
Brief
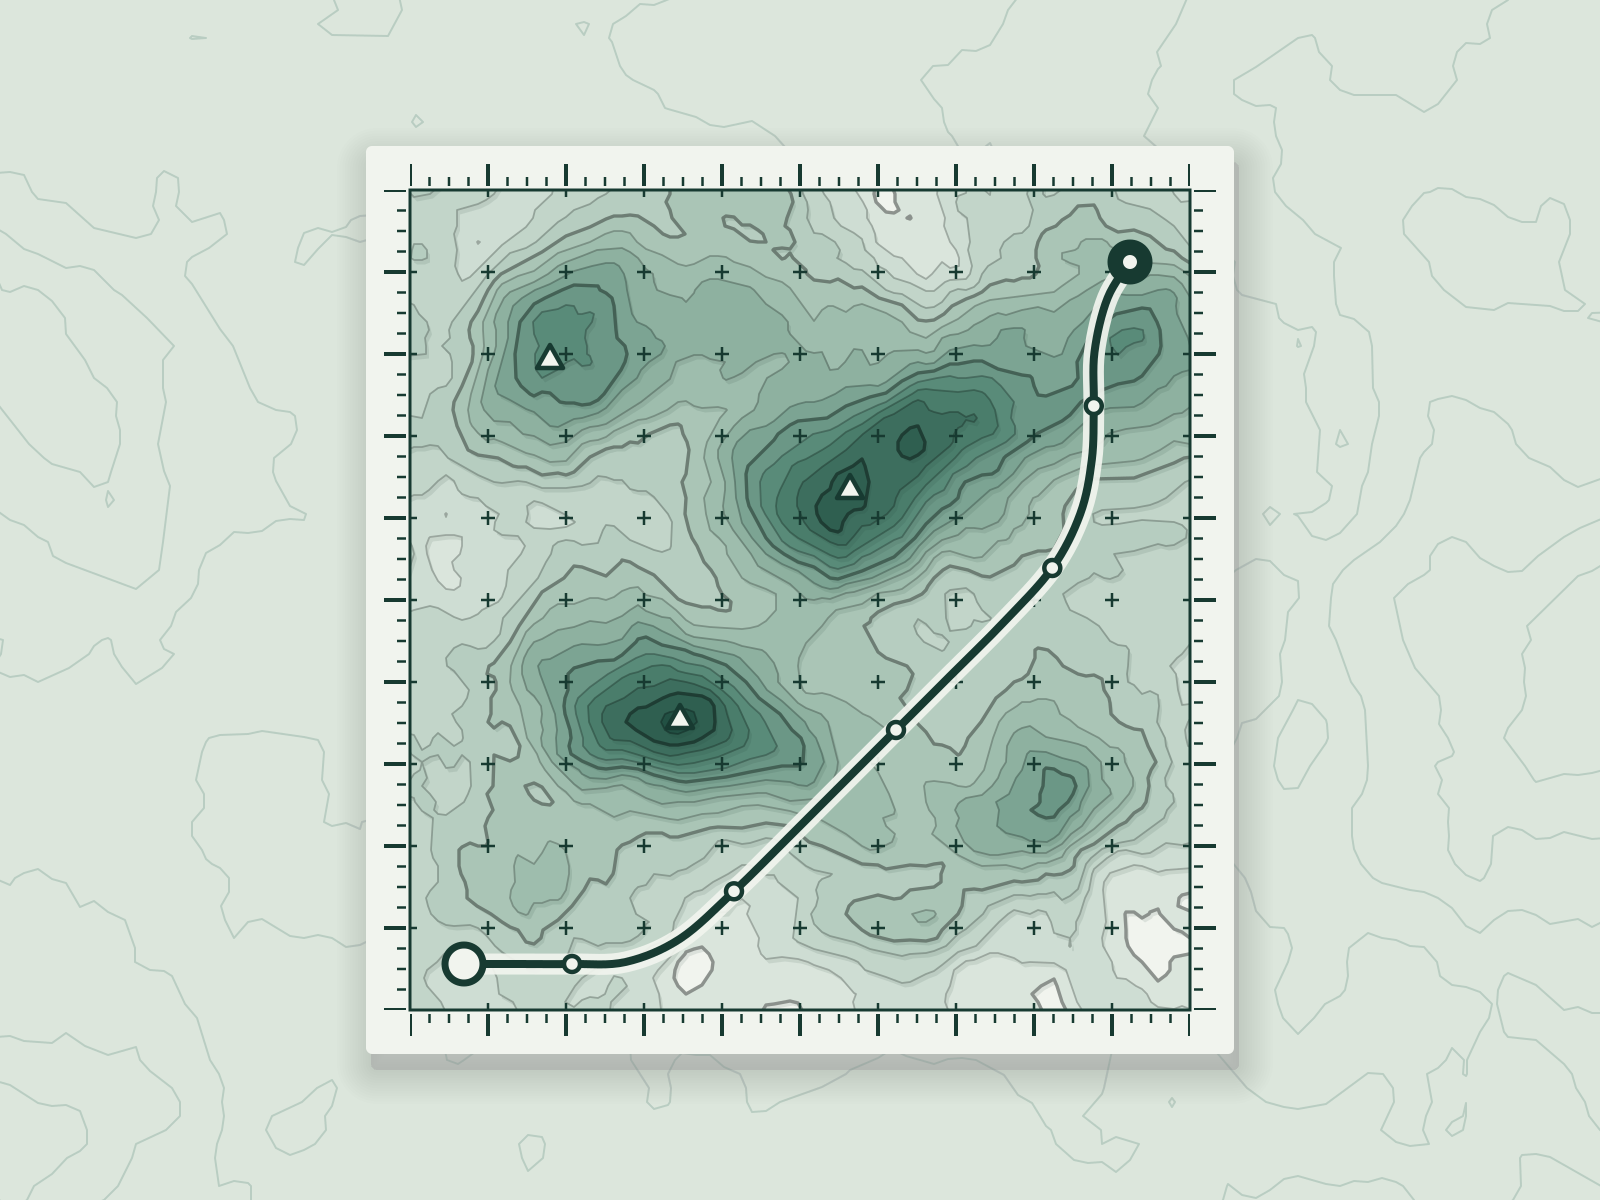
The grid operator publishes everything and explains nothing. The foundation wanted forty datasets to read as one place.
Idea
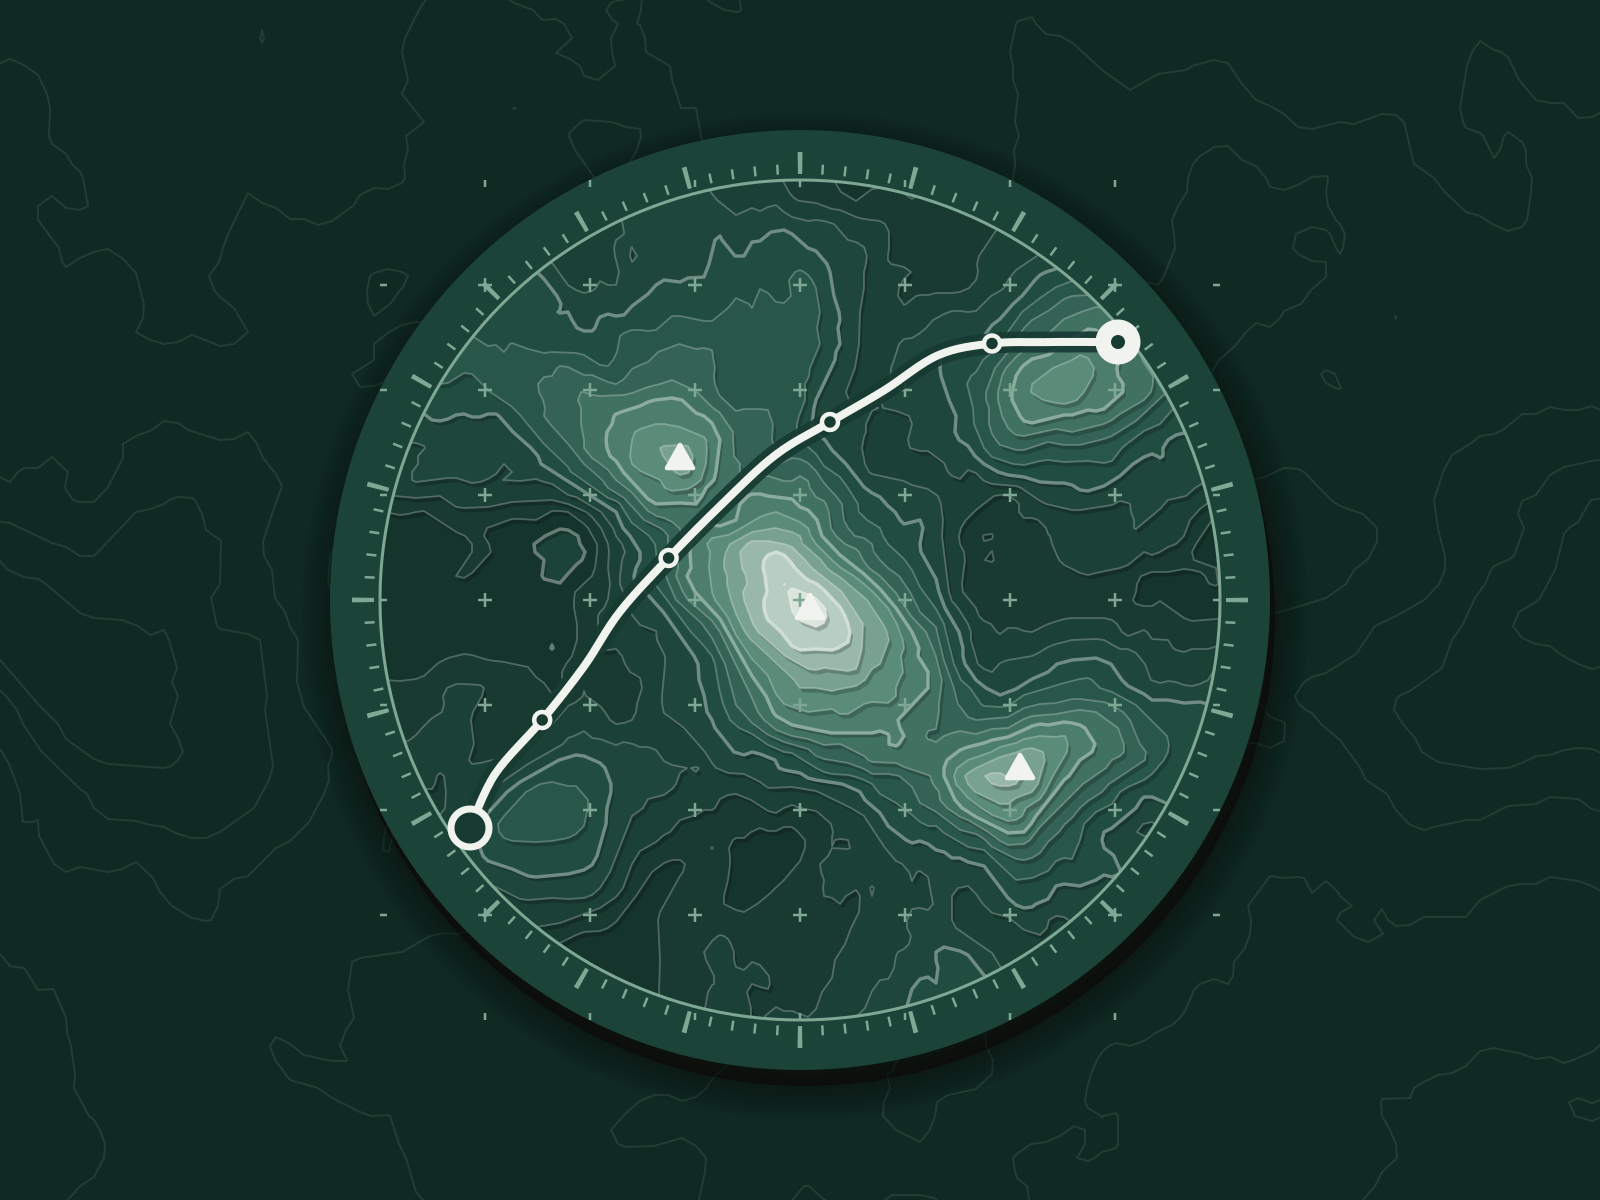
A single terrain: height is demand, contour is congestion, colour is carbon. You read it the way you read a hillside.
Build
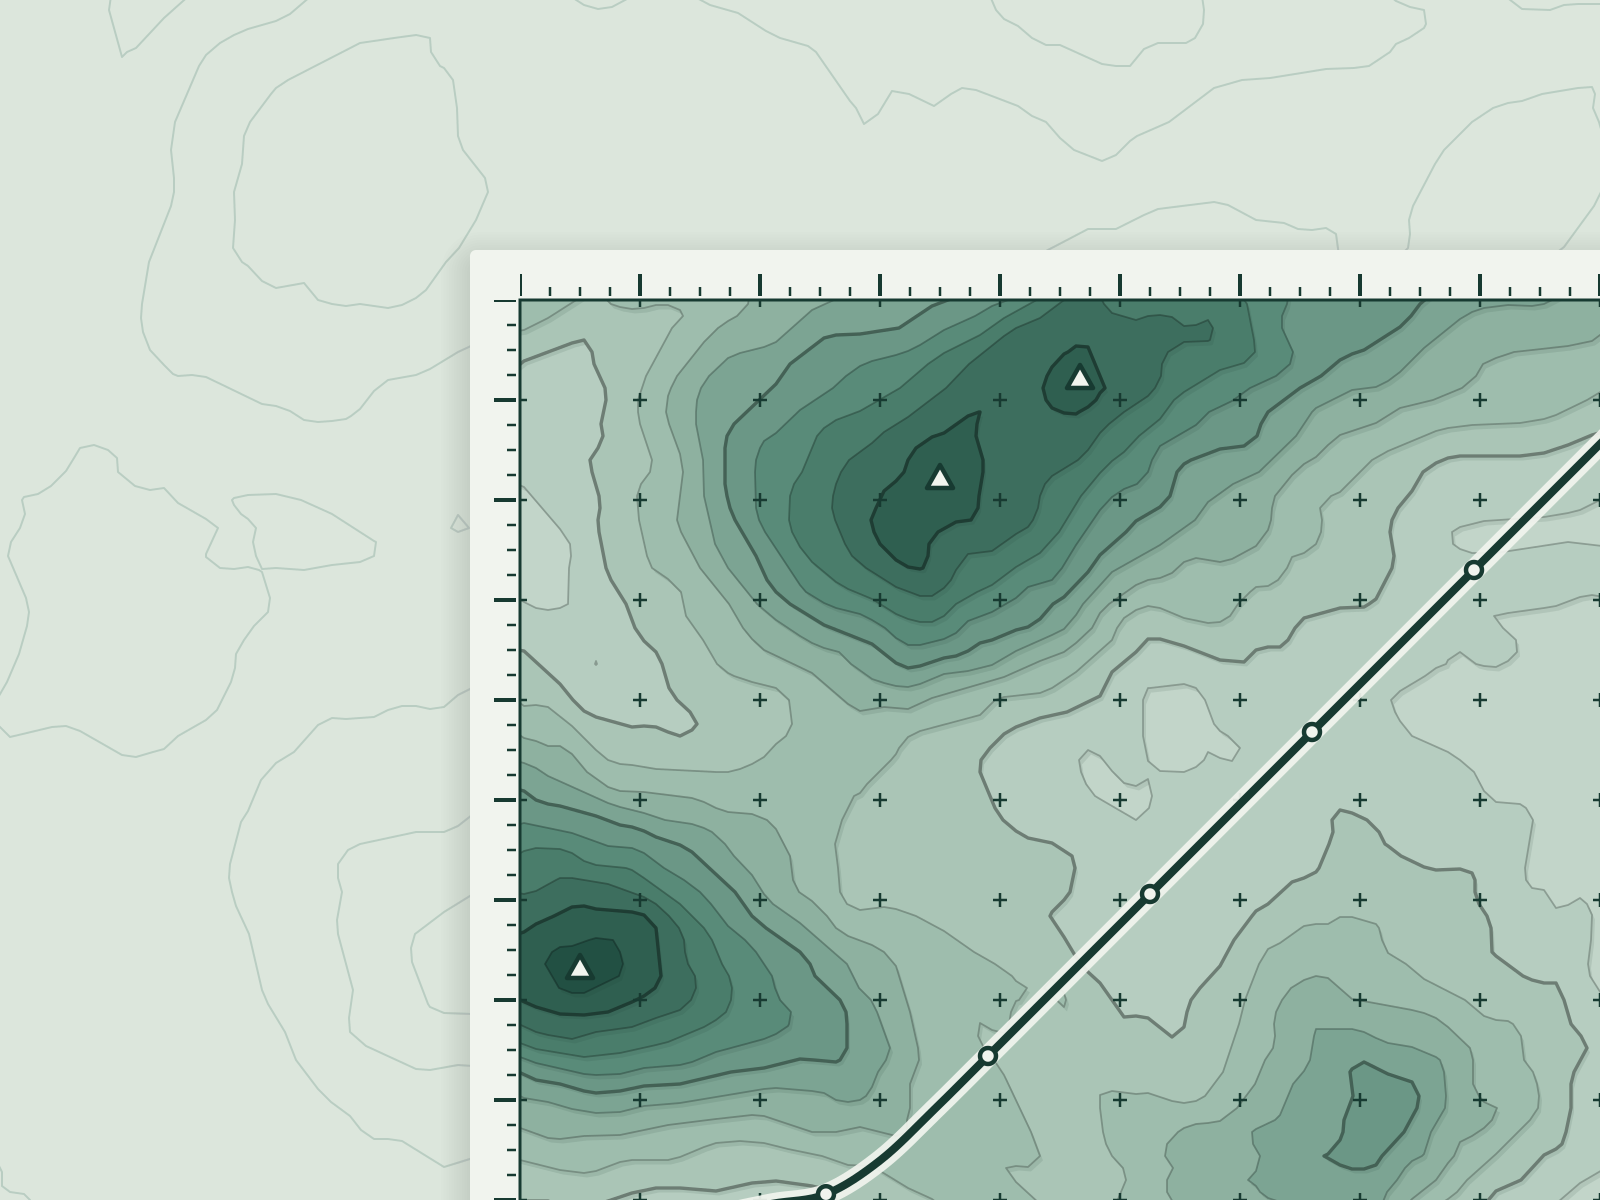
Twenty weeks with researchers, two engineers and a design system that treats every chart as a map layer.
Launch
It shipped with full keyboard and screen-reader support, and every layer has a plain-language caption.
After
Journalists and regulators began linking to single maps instead of PDFs. It is now the first thing a new analyst is shown.
- 100accessibility audit score
- 1.1Mmap sessions in six monthsEach dot is 100,000
- 3regulator briefs cite it
Award
- Kiln Craft PrizeSilver, Data and software, 2025