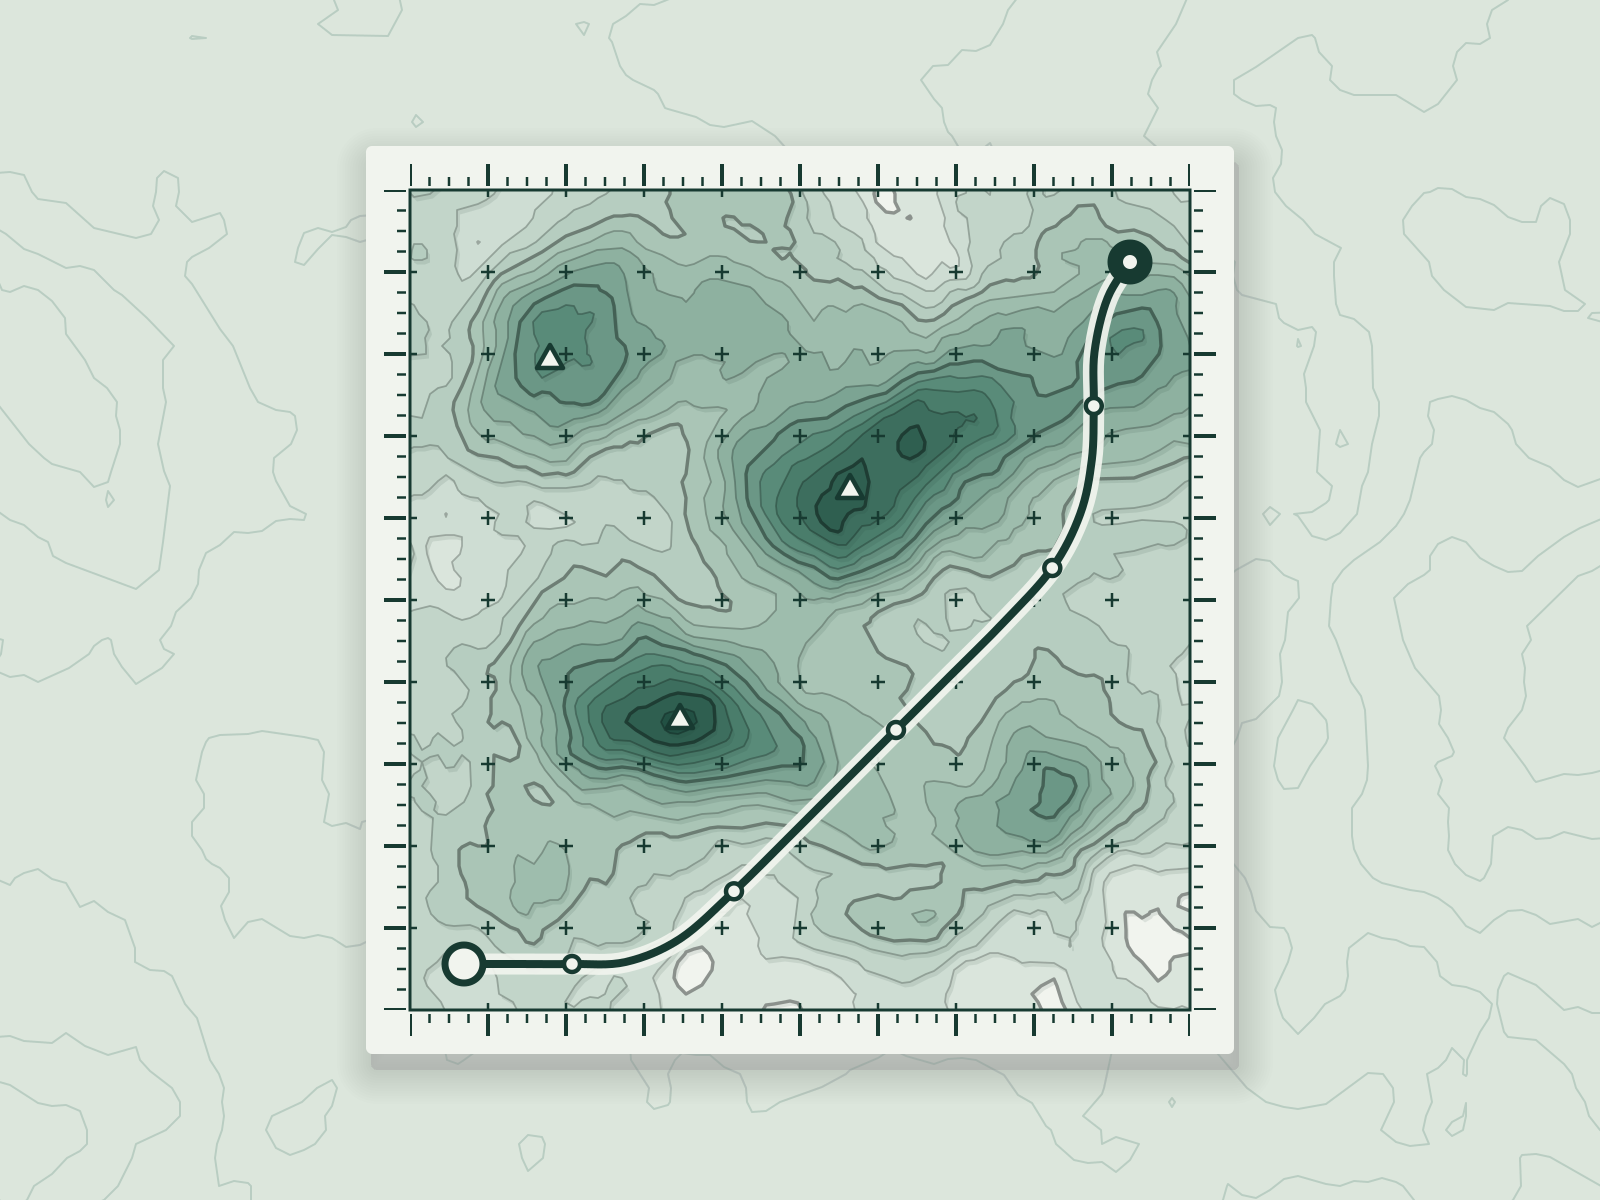
Tidepool
A climate-data tool that shows sea-level risk street by street.
Product and Software
- Client
- Tidepool Climate
- Year
- 2022
- Role
- Product design, data design, front-end
- Time
- 18 weeks
- Crew
- 6 people
Brief
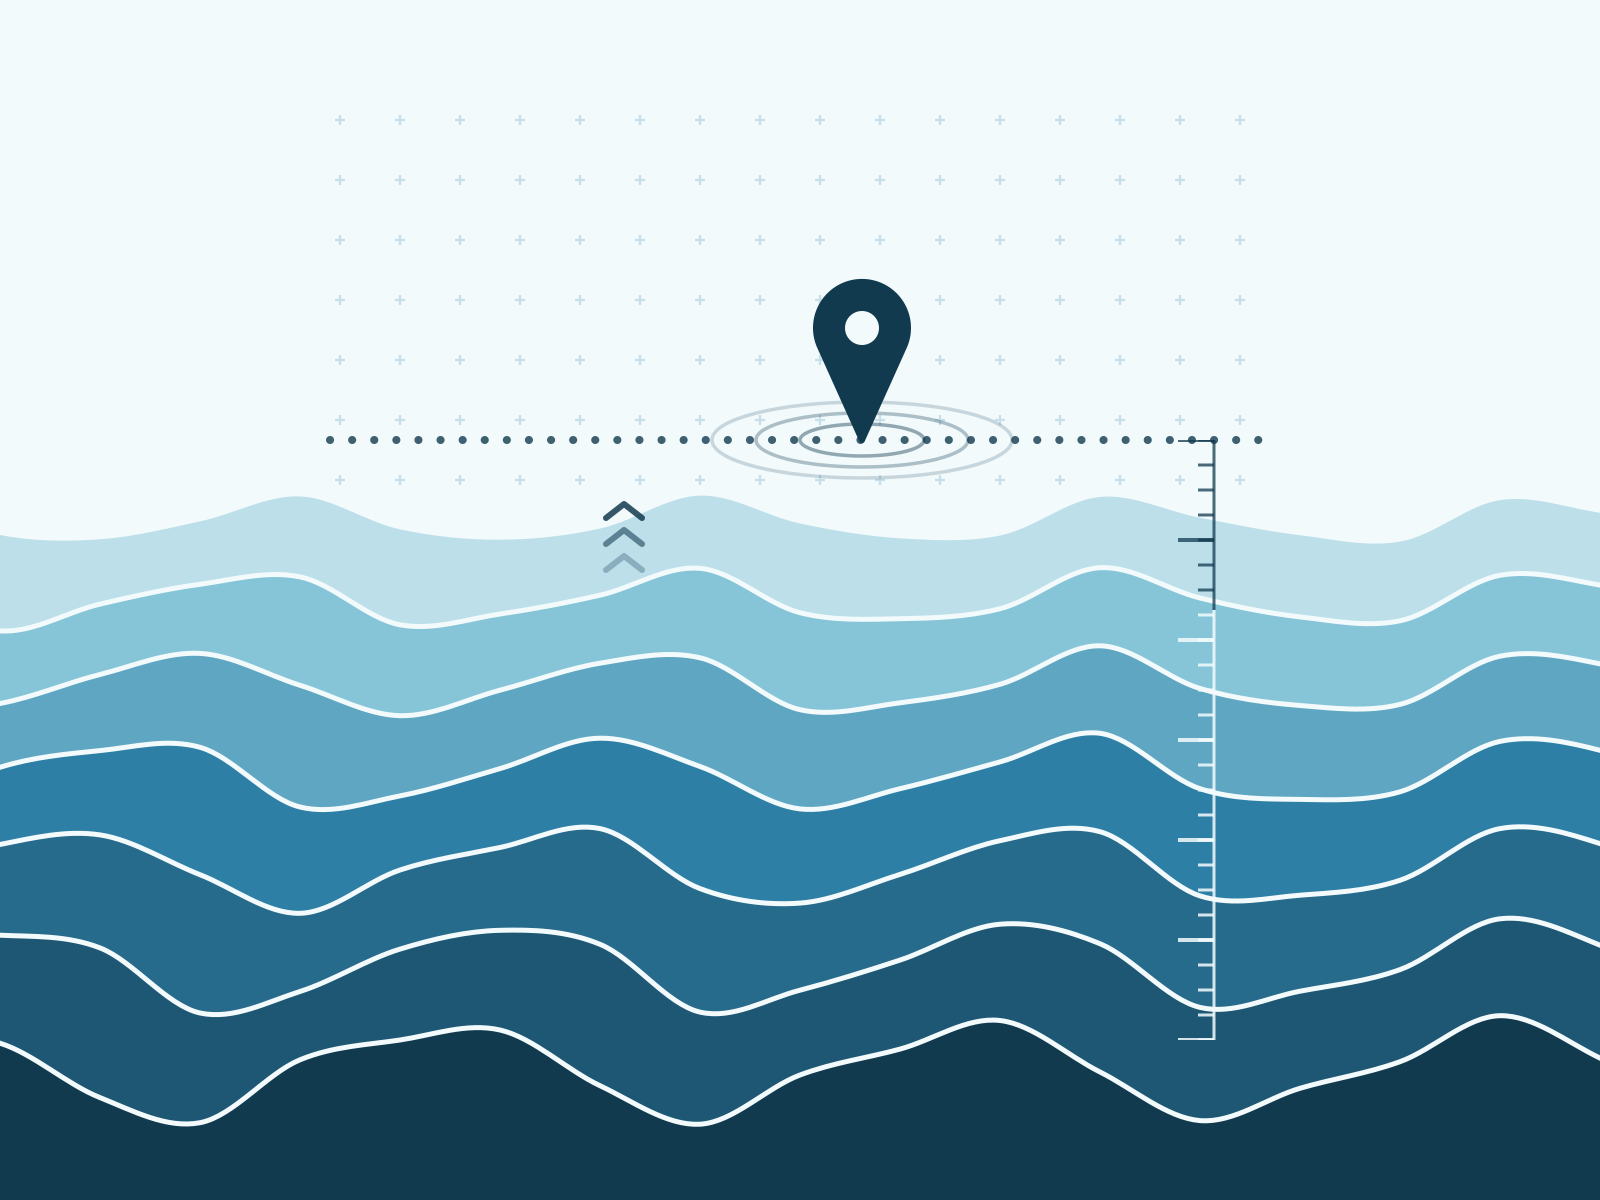
Risk maps are usually a red blob on a coastline. People wanted to know about their own street.
Idea
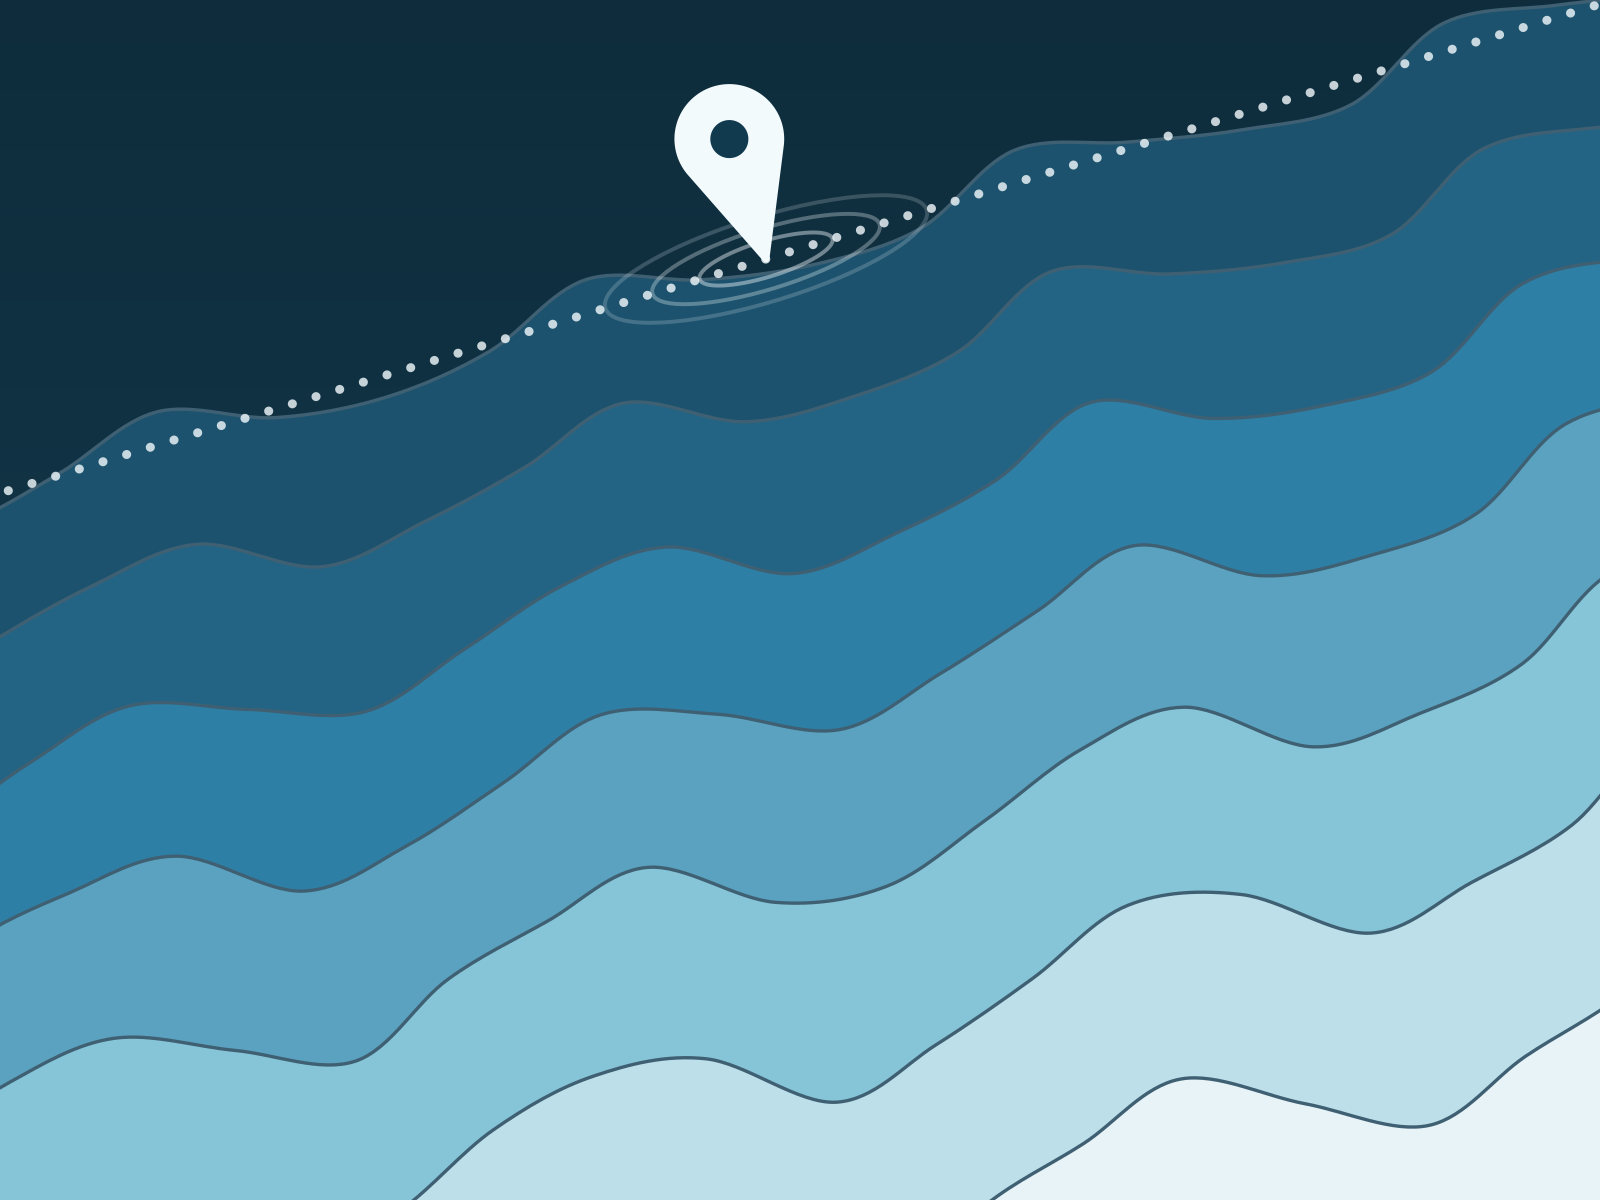
Type an address and watch the water arrive, decade by decade, in the street you know.
Build
Eighteen weeks, with a hard rule that it had to work on a weak signal.
Launch
It launched with fourteen councils embedding it on their own sites.
After
Council officers started bookmarking it on their phones, and it still loads quickly on the weakest signal in the valley.
- 210kaddresses searchedEach dot is 10,000
- 0.8slargest paint on 4G
- 14councils embed it
Award
- Civic Design CommendationCommended, Public information, 2023